 Passer au contenu principal Passer au pied de page


Les installations industrielles prennent souvent des risques en matière de sécurité en s'en remettant à des inspections visuelles subjectives, alors qu'une accumulation de seulement 1/32 de pouce (0,8 mm) de poussière — à peu près l'épaisseur d'un trombone — constitue le seuil défini de risque d'explosion selon la norme NFPA 654. Passer d'une maintenance réactive à une visualisation pilotée par des capteurs permet aux opérateurs de remplacer l'intuition par des données empiriques, en tirant parti des diagnostics IA pour réduire le dépannage des composants de 120 minutes à seulement 5 minutes.
Cette analyse explore l'ingénierie derrière le chargement de masse piézoélectrique et le passage à une qualité de l'air quantifiée. Nous évaluons comment des plateformes telles que les... Flex-Kleen iSeries et 75F's Easy Street utilisent ISO 14644-1 et ASHRAE 199 normes pour transformer les particules invisibles en graphiques à barres exploitables et en scores de sécurité gamifiés.

L'évolution des technologies de nettoyage : de l'aspiration au capteur
Cleaning tech shifted from simple suction to sensor-driven visualization. Systems now use IoT diagnostics to track submicron particles, meeting ASHRAE 199 and ISO 14644-1 standards for safety.
Legacy Systems and the Science of Particulate Visualization
Industrial dust was once treated as a simple mechanical nuisance. Engineers eventually shifted focus toward making invisible aerosols measurable through high-precision imaging and deposit analysis. This transition replaced “naked eye” inspections with quantified data, leading to the development of the first cleanroom standards.
- Thermal precipitators: Collected particles smaller than 10 µm onto electron-microscope grids to prevent imaging bias.
- Aerosol metrology: Utilized moving acetate-film ribbons and optical density to convert dust concentration into a continuous visual trace.
- ISO 14644-1: Established thresholds for particle counts (0.1 µm to 5 µm) across ISO Classes 1–9.
- HEPA and MERV: Defined standardized efficiency profiles based on exact particle size removal.
The Digital Shift: IoT Diagnostics and Performance Standards
Moderne systèmes de filtration move beyond static ratings. They utilize IoT-enabled diagnostics to monitor system health in real-time. This allows operators to correlate visible grinding dust with submicron welding fumes that would otherwise go undetected by traditional collectors.
- ASHRAE Standard 199-2016: A 6-stage lifecycle test using calcium carbonate test dust to simulate real-world pulse-jet loading.
- MERV 16/16A: Filtration standards requiring 95% removal efficiency for particles ≥0.3 µm.
- NFPA 68 and 69: Safety protocols for explosion venting and prevention in systems handling combustible dust.
- IoT Systems: Platforms like the Flex-Kleen iSeries provide continuous monitoring of differential pressure, pulse frequency, and emissions.
- MERV-A: Includes conditioning tests to prevent efficiency degradation over the filter’s life.
These digital tools transform dust from an environmental risk into a controllable process variable. By aligning real-time sensor data with ASHRAE and ISO standards, facilities ensure both operational safety and consistent air quality without relying on manual spot checks.
La science des capteurs piézoélectriques : quantifier les micro-poussières
Piezoelectric sensors measure respirable dust by tracking frequency drops on vibrating quartz crystals. This mass-loading effect enables real-time, microgram-level quantification of particles under 8 µm.
Piezoelectric Mass-Loading and Resonant Frequency Shifts
Piezoelectric sensors bypass traditional particle counting by using the mass-loading effect. When micro-dust settles on a vibrating quartz crystal, the added mass forces the resonant frequency to drop. This shift provides an immediate electronic signal proportional to the accumulated mass in the gas stream.
- Substrate: AT-cut quartz crystal (1.3 cm diameter, 180 µm thick).
- Base Frequency: 9 MHz resonance.
- Electrodes: Gold or silver surfaces for particle deposition.
- Configuration: 9-element modular arrays for in-situ monitoring in aerospace or heavy manufacturing.
High Q-factor engineering ensures these systems detect microgram mass changes. This sensitivity allows operators to identify fluctuations in air quality before they violate safety thresholds or damage precision equipment.
Quantitative Metrics and Size Selectivity Standards
Accuracy depends on the Sauerbrey relationship, which translates frequency shifts into mass data. Industrial systems isolate specific particle sizes to ensure data reflects respirable risks rather than harmless larger debris that could bias the sensor.
- Calculation: ΔF = -Dm · F / (R · t · A) (where Dm represents mass change in µg).
- Size Threshold: Respirable dust limited to <8 µm; larger particles are diverted via cyclones.
- Thermal Stability: GT-cut quartz variants eliminate temperature coefficients between 0–40°C.
- Mechanical Spec: PVDF piezo films provide a modulus of 10^9–10^10 Pa with moisture absorption below 0.02%.
These metrics align with ISO 14644-1 and ASHRAE 199. By integrating these sensors into IoT-enabled collectors, facilities move from reactive maintenance to quantified, real-time visualization of dust as a dynamic process variable.
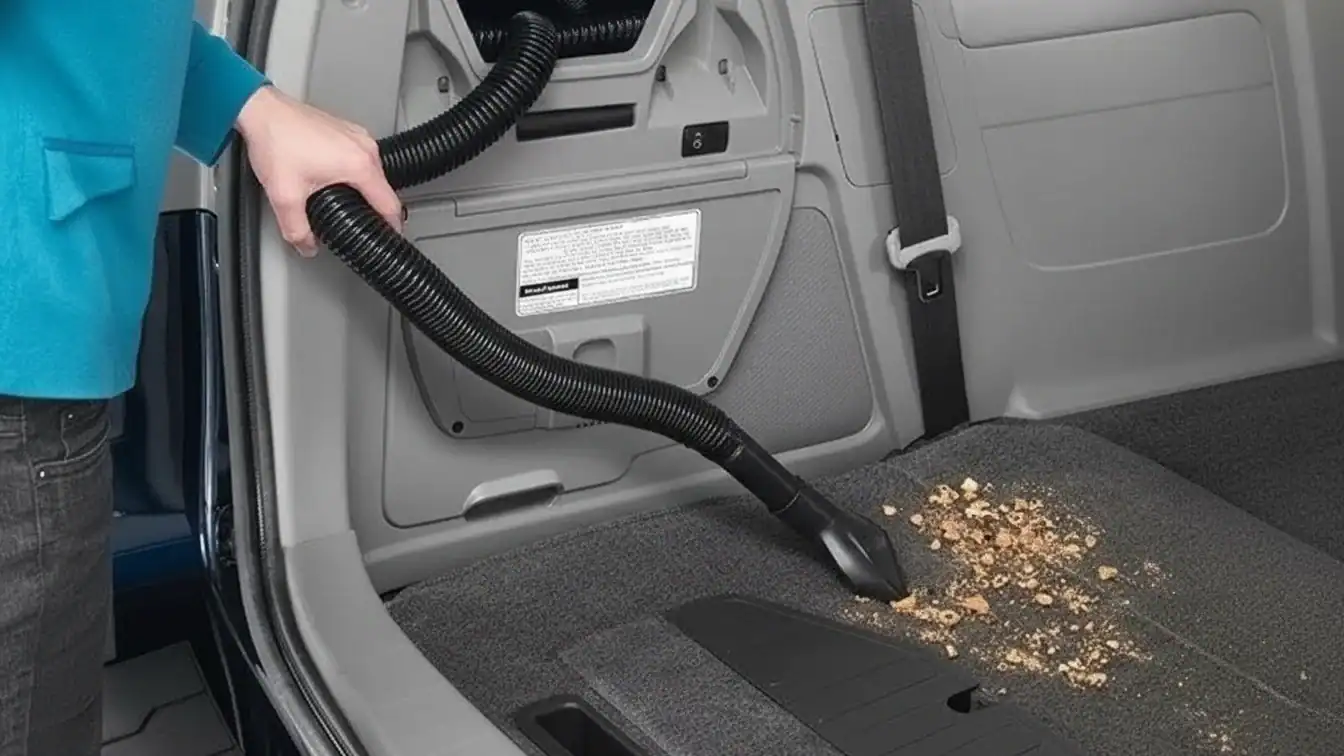
Visualiser la propreté : comment les graphiques à barres fournissent une preuve en temps réel
Bar graphs convert sensor data and accumulation formulas into immediate visual evidence, contrasting pre- and post-cleaning dust levels to validate filtration performance and operational air quality.
| Metric/Parameter | Norme technique / Valeur | Role in Visualization |
|---|---|---|
| Accumulation Model | p(t) = A(α + βt) | Predicts deposition rates based on surface area. |
| Sensor Accuracy | ±3% (TSI Model 8475) | Ensures empirical data integrity in real-time graphs. |
| Efficacité de filtration | MERV 14/16 (ASHRAE 52.2) | Sets the benchmark for particle removal rates. |
| Protocole d'échantillonnage | 15s intervals / 30.5×43.0 cm grid | Provides statistically significant proof of distribution. |
Empirical Validation: Measuring Respirable Dust Interventions
Most industrial air quality claims rely on guesswork. Real-time monitoring systems replace that ambiguity with bar graphs that contrast average respirable dust concentrations before and after cleaning. These side-by-side comparisons offer immediate proof of whether a ventilation change or cleaning cycle actually worked.
Visual proofs highlight that dust spikes align strictly with operational activity. During inactive periods, such as weekends, graphs show minimal variation, confirming that the air de l'eau locale sont pilotés par des processus. Le mappage de texture computationnel affine ces visualisations en modélisant les éléments de rugosité — comme les poils et les amas — à l’aide des angles de vue pour aligner les données numériques avec la réalité physique.
KelyLands aspirateurs intègrent des systèmes de filtration HEPA pour réduire ces concentrations mesurées. Les interfaces numériques suivent cette réduction en temps réel, permettant aux gestionnaires de visualiser l’élimination des particules submicroniques. Ce passage d’une simple aspiration à des données validées par des capteurs transforme le nettoyage en protocole de sécurité certifié.
Paramètres techniques : Modélisation de l’accumulation et précision des capteurs
La précision n’est pas accidentelle ; elle repose sur une modélisation mathématique spécifique et un matériel de haute précision. Pour visualiser la propreté, les ingénieurs utilisent un modèle dynamique de concentration de poussière qui tient compte à la fois des taux de génération et de la performance de ventilation. Cela permet d’obtenir des graphiques à barres prédictifs, même dans des conditions non isothermes où les mouvements de l’air sont imprévisibles.
- Formule d’accumulation : p(t) = A(α + βt), où A est la surface et α/β représentent les taux de dépôt à haute densité.
- Précision du capteur : Le modèle TSI 8475 offre une précision de ±3% ou ±1% à pleine échelle pour la vitesse de l’air et le mouvement des particules.
- Grilles standardisées : Les protocoles d’échantillonnage utilisent des grilles de 30,5 × 43,0 cm afin d’assurer la cohérence des données sur différents volumes de contrôle.
- Références pour salles blanches : L’ISO 14644-1 spécifie le nombre maximal de particules par m³ pour des tailles comprises entre 0,1 µm et 5 µm.
- Normes de filtration : La norme ASHRAE 199-2016 définit des tests en 6 étapes utilisant de la poussière de carbonate de calcium pour simuler une charge réelle.
Cette approche riche en données permet aux gestionnaires d’établir un lien entre les copeaux visibles et les aérosols submicroniques invisibles. Grâce à des diagnostics connectés IoT, les systèmes fournissent des tableaux de bord en temps réel sur l’état des filtres et les niveaux d’émissions. Cela garantit que les performances du système sous charge correspondent aux enveloppes de sécurité requises par les normes NFPA 68 et 69.
Solutions de fabrication premium OEM/ODM pour aspirateurs domestiques

Gamification : la psychologie de la boucle de rétroaction du nettoyage
Gamification uses real-time scoring and AI diagnostics to turn maintenance into a measurable game, reducing diagnostic times from hours to minutes through immediate feedback loops.
Behavioral Reinforcement: Positive and Negative Feedback Loops
Feedback loops in professional environments rely on a three-phase cycle: user action, an event, and a modified experience that triggers a repeat action. Positive loops use accomplishment and rewards to reinforce behavior. Negative loops use challenges or consequences to force skill refinement.
This mirrors the mechanics of language learning apps. When a technician receives immediate data on an error, the “point loss” or negative feedback drives instant correction. This cycle transforms repetitive tasks into an active pursuit of a perfect score.
Quantifying Performance: Real-Time Scoring and AI Diagnostics
Systems like 75F’s Easy Street assign specific site installation scores to quantify work quality. These scores generate automated punch lists for issues like offline sensors or unoptimized configurations, removing the guesswork from site commissioning.
- Site Installation Scores: Automated grading (e.g., 86/100 or 92/100) provides a baseline for technician performance.
- Diagnostic Efficiency: AI diagnostics reduce traditional troubleshooting from 120 minutes to just 5 minutes for specific component failures.
- Integration Ecosystems: Connectivity with Salesforce, HubSpot, and Microsoft Teams enables real-time coaching across existing workflows.
Platforms like Spinify and Centrical sustain this engagement through “Voice of the Employee” tools. By utilizing personalized goals and real-time guidance, these systems replace static annual reviews with continuous, data-driven improvement cycles.
Vendre la “preuve” : pourquoi le nettoyage basé sur des preuves remporte l'adhésion
Evidence-based cleaning replaces subjective “looks clean” standards with measurable data, using NFPA thresholds and real-time IoT sensors to verify safety and compliance.
| Standard / Metric | Threshold / Benchmark | Application |
|---|---|---|
| NFPA 654 | 1/32 inch (0.8 mm) | Combustible dust safety limit for surfaces. |
| ISO 14644-1 | Particle counts per m³ | Cleanroom cleanliness classification. |
| MERV 14/16 | ≥75% to 95% efficiency | Filtration of particles ≥0.3 µm. |
| EPA Method 9/22 | Visual Opacity % | Daily proof of emission control performance. |
Quantitative Benchmarks: NFPA 1/32-Inch and Visual Thresholds
Subjectivity is a liability in high-stakes environments. Facilities shift from “guessing” to “knowing” by adopting the NFPA 654 benchmark. This standard defines a hard limit for dust accumulation that dictates when a facility is safe or a localized explosion hazard.
- NFPA 654 Limit: 1/32 inch (0.8 mm) dust layer thickness for combustible materials.
- Layer Depth Criterion (LD): Formula used to adjust thresholds based on specific dust bulk density (ρ).
- Paper Clip Rule: A ~1 mm visual field indicator used by technicians to trigger immediate cleaning.
- NFPA 652 Housekeeping: Mandates documented programs that establish a visual baseline for every shift.
Using these metrics turns a cleaning crew into a compliance team. When you use the LD formula to calculate specific bulk density risks, you provide a data-driven safety product rather than a janitorial service.
Advanced Verification: IoT Monitoring and Analytical Validation
The transition “from suction to sensor” allows for continuous verification. Modern dust collectors and cleanrooms no longer rely on annual audits. They use live diagnostics to prove air quality and surface cleanliness in real-time.
- IoT Diagnostics: Sensors monitor differential pressure and pulse-cleaning frequency to log performance.
- Optical Monitoring: Records particle concentrations from 0.1 μm to 100 μm for ISO compliance.
- ASHRAE 199-2016: Standardized test dust (calcium carbonate) used to simulate real-world loading and cleaning.
- Analytical Validation: High-spec pharma cleaning requires residue sensitivity levels below numeric safety limits.
Precision industries require validated visual inspection protocols. By linking “visually clean” statuses to analytical residue thresholds and time-stamped IoT logs, facilities transform perception into a regulatory data product. This level of proof is mandatory for maintaining ISO 14644-1 classes and meeting EPA opacity requirements.
Mise en œuvre technique pour les chasseurs d'innovation
Use ASTM D1739 and OSHA standards to calibrate 10×20 spatial grids, turning discrete sensor data into real-time heatmaps for hardware testing and worker safety.
Standards-Based Frameworks for Dust Measurement and Exposure
Innovation scouts must ground visualization in established engineering metrics rather than visual estimation. Relying on standardized deposition and concentration limits ensures that color-coded dashboards reflect actual regulatory and hardware risks.
- ASTM D1739: Quantifies settleable particulate matter (dustfall) in mg/m²/day using standardized cylindrical gauges.
- OSHA 29 CFR 1910.1000: Sets Time Weighted Average (TWA) thresholds for total and respirable dust in mg/m³.
- NASA-STD-1008: Defines “dirty room” test environments using micrometer-scale (µm) particle-size bounds for hardware stress testing.
- ISO 14644-1: Provides the particle count per m³ baseline across ISO Classes 1–9 for cleanroom and high-precision environments.
Spatio-Temporal Data Modeling and Visualization Platforms
Turning raw data into a heatmap requires interpolating discrete sensor readings across a spatial grid. Modern systems integrate IoT diagnostics and meteorological vectors to move from simple air quality monitoring to predictive safety analytics.
- Spatial Interpolation: Deploy 10 × 20 grids to transform single-point monitor data into continuous concentration surfaces.
- ASHRAE 199-2016: Validates collector behavior using calcium carbonate (CaCO₃) test dust to model real-world loading and cleaning cycles.
- Multi-Sensor Fusion: Integrates airborne concentration, particle size distribution, and wind vectors for real-time decision support.
- IoT Diagnostics: Systems like the CECO Flex-Kleen iSeries track differential pressure and pulse-cleaning frequency to visualize filter health and explosion safety risks (NFPA 68/69).
Wearable optical sensors now provide second-scale temporal resolution. When paired with worker-path traces, these sensors generate exposure trajectory heatmaps that allow safety managers to pinpoint specific operational hazards in mining and construction sites.
Conclusions finales
Subjective cleaning is a liability that invites safety violations and regulatory fines. Switching to sensor-driven visualization transforms maintenance from an overhead cost into a measurable, data-backed safety protocol.
Stop guessing and start measuring. Audit your facility against NFPA 654 standards and install IoT-enabled collectors to turn invisible dust into actionable, real-time data points.
Questions fréquemment posées
Does the dust visualization unit use a Piezo sensor or an Infrared dust sensor?
No single industry standard mandates one over the other. Piezoelectric and infrared (IR) optical sensors are both common in commercial monitors. Both technologies accurately classify PM2.5 and PM10 mass fractions according to regulatory definitions.
How are different particle sizes like PM2.5 and PM10 visualized on the screen?
Compliant screens map measurements into distinct size bins based on EPA Method 201A and WHO guidance. PM2.5 represents particles ≤2.5 µm, while PM10 includes particles ≤10 µm. Units typically report these as separate channels to provide a clear view of air or surface quality.
Is the sensor data linked to automatic suction adjustment in the vacuum?
Many smart appliances use particle sensor output as a control variable for closed-loop suction adjustment. This linkage is manufacturer-specific rather than a formal industrial mandate, allowing the device to adjust motor power dynamically based on detected dust levels.

 English
 Español
 Français
 Deutsch
 Português do Brasil
 Русский
 한국어
 日本語
 العربية