 메인 콘텐츠로 건너뛰기 푸터로 건너뛰기


Industrial facilities often gamble with safety by relying on subjective visual inspections, yet an accumulation of just 1/32 inch (0.8 mm) of dust—roughly the thickness of a paper clip—is the defined threshold for an explosion hazard under NFPA 654. Transitioning from reactive maintenance to sensor-driven visualization allows operators to replace guesswork with empirical data, leveraging AI diagnostics to reduce component troubleshooting from 120 minutes to just 5 minutes.
This analysis explores the engineering behind piezoelectric mass-loading and the shift toward quantified air quality. We evaluate how platforms such as the Flex-Kleen iSeries 그리고 75F’s Easy Street utilize ISO 14644-1 그리고 ASHRAE 199 standards to turn invisible particulates into actionable bar graphs and gamified safety scores.

The Evolution of Cleaning Tech: From Suction to Sensor
청소 기술이 단순한 흡입에서 센서 기반 시각화로 전환되었습니다. 이제 시스템은 IoT 진단을 활용해 아황미크론 입자를 추적하며, 안전을 위해 ASHRAE 199 및 ISO 14644-1 기준을 준수합니다.
기존 시스템과 입자 시각화의 과학
산업용 먼지는かつて 단순한 기계적 폐해로 취급되었습니다. 엔지니어들은 Eventually 고정의 영상 기술과 침적 분석을 통해 보이지 않는 에어로졸을 측정 가능하게 만드는 데 중점을 두기 시작했습니다. 이 전환은 “육안” 검사를 정량적 데이터로 대체했으며, 이는 첫 번째 클린룸 기준 개발로 이어졌습니다.
- 열식 침강관: 이미징 편향을 방지하기 위해 10 µm 미만의 수집 입자를 전자현미경 그리드에 담습니다.
- 에어로졸 계측: 이동식 아세테이트 필름 리본과 광학 밀도를 활용하여 먼지 농도를 지속적인 시각적 기록으로 변환합니다.
- ISO 14644-1: ISO 등급 1~9 전반에 걸쳐 입자 수(0.1 µm ~ 5 µm)의 허용 한계를 설정했습니다.
- HEPA 및 MERV: 정확한 입자 크기 제거를 기반으로 한 표준화된 효율 프로파일을 정의합니다.
디지털 전환: IoT 진단과 성능 기준
현대 필터링 시스템 정적 등급을 넘어섭니다. IoT 기반 진단을 활용하여 시스템 상태를 실시간으로 모니터링합니다. 이를 통해 운영자는 가시적인 연삭 먼지와 기존 집진기로는 탐지하기 어려웠던 아황미크론 용접 흄을 상관관계 분석할 수 있습니다.
- ASHRAE 표준 199-2016: 실제 환경의 펄스제트 하중을 시뮬레이션하기 위해 탄산칼슘 시험 먼지를 사용한 6단계 수명주기 시험입니다.
- MERV 16/16A: Filtration standards requiring 95% removal efficiency for particles ≥0.3 µm.
- NFPA 68 and 69: Safety protocols for explosion venting and prevention in systems handling combustible dust.
- IoT Systems: Platforms like the Flex-Kleen iSeries provide continuous monitoring of differential pressure, pulse frequency, and emissions.
- MERV-A: Includes conditioning tests to prevent efficiency degradation over the filter’s life.
These digital tools transform dust from an environmental risk into a controllable process variable. By aligning real-time sensor data with ASHRAE and ISO standards, facilities ensure both operational safety and consistent air quality without relying on manual spot checks.
The Science of Piezo Sensors: Quantifying Micro-Dust
Piezoelectric sensors measure respirable dust by tracking frequency drops on vibrating quartz crystals. This mass-loading effect enables real-time, microgram-level quantification of particles under 8 µm.
Piezoelectric Mass-Loading and Resonant Frequency Shifts
Piezoelectric sensors bypass traditional particle counting by using the mass-loading effect. When micro-dust settles on a vibrating quartz crystal, the added mass forces the resonant frequency to drop. This shift provides an immediate electronic signal proportional to the accumulated mass in the gas stream.
- Substrate: AT-cut quartz crystal (1.3 cm diameter, 180 µm thick).
- Base Frequency: 9 MHz resonance.
- Electrodes: Gold or silver surfaces for particle deposition.
- Configuration: 항공우주 및 중공업 현장 모니터링용 9요소 모듈어 어레이.
고품질 계수 엔지니어링을 통해 마이크로그램 단위의 질량 변화까지 감지합니다. 이 높은 민감도로 운영자는 공기질이 안전 기준을 초과하거나 정밀 장비에 손상을 주기 전에 이상 신호를 조기에 발견할 수 있습니다.
정량적 지표 및 크기 선택성 표준
정확도는 주파수 변화를 질량 데이터로 변환하는 사우어브레이 관계에 기반합니다. 산업용 시스템은 특정 입자 크기를 분리해 센서가 유해하지 않은 대형 미세먼지에 의해 편향되지 않고, 실제로 호흡으로 흡입될 위험이 있는 입자 데이터를 반영하도록 합니다.
- 계산식: ΔF = -Dm · F / (R · t · A) (Dm: μg 단위의 질량 변화).
- 크기 기준: 호흡 가능 먼지 <8 µm 제한; 대형 입자는 사이클론을 통해 분리.
- 열안정성: GT-cut 석영 버전은 0–40°C 범위에서 온도 계수를 제거합니다.
- 기계 사양: PVDF 압전 필름은 10^9–10^10 Pa의 탄성 계수를 가지며, 수분 흡수량은 0.02% 미만입니다.
이러한 지표는 ISO 14644-1 및 ASHRAE 199 표준과 부합합니다. 이러한 센서를 IoT 연결 수집 시스템에 통합하면 시설은 사후 대응 유지보수에서 벗어나, 먼지를 동적 공정 변수로 정량화하고 실시간 시각화하는 체계로 전환됩니다.
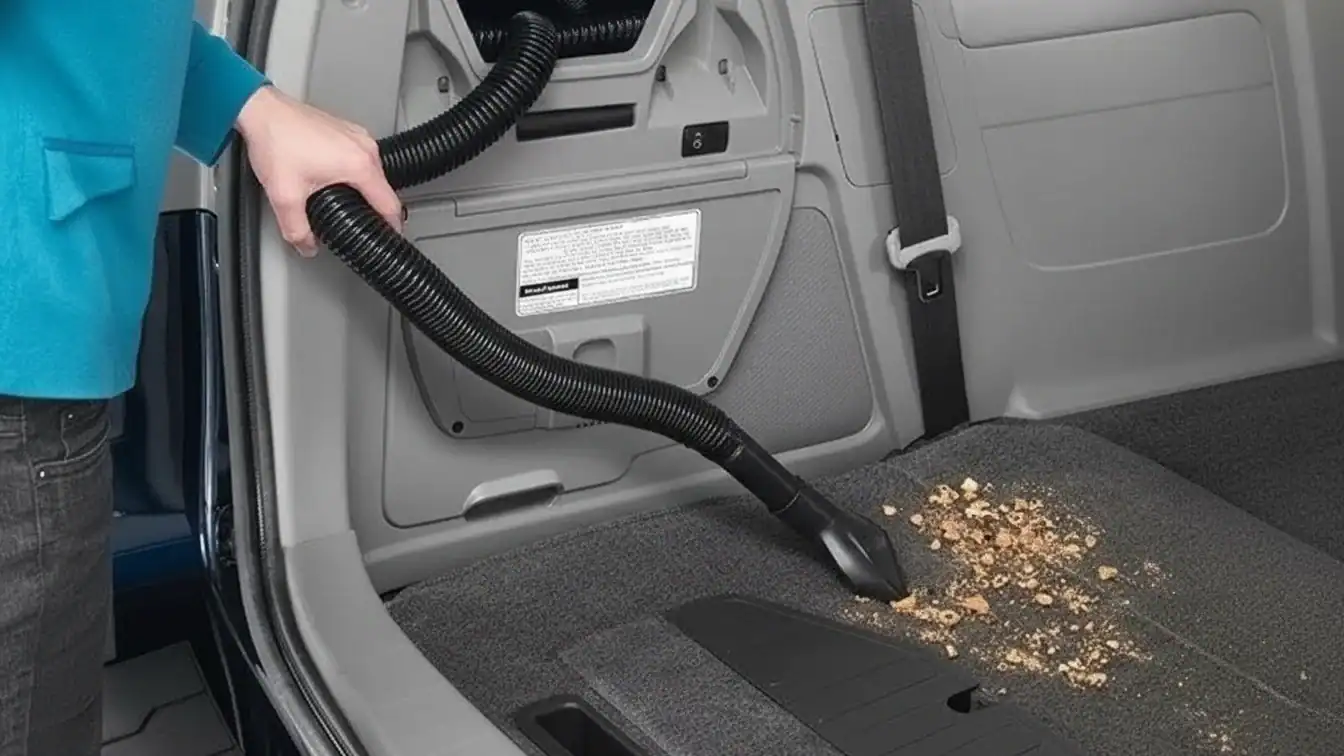
Visualizing Clean: How Bar Graphs Provide Real-Time Proof
막대 그래프는 센서 데이터와 누적 공식을 즉시 시각화하여, 청소 전후의 먼지 양을 대조함으로써 여과 성능과 작업 환경의 공기질을 입증합니다.
| Metric/Parameter | 기술 표준 / 값 | Role in Visualization |
|---|---|---|
| Accumulation Model | p(t) = A(α + βt) | Predicts deposition rates based on surface area. |
| Sensor Accuracy | ±3% (TSI Model 8475) | Ensures empirical data integrity in real-time graphs. |
| 필터링 효율성 | MERV 14/16 (ASHRAE 52.2) | Sets the benchmark for particle removal rates. |
| 샘플링 프로토콜 | 15s intervals / 30.5×43.0 cm grid | Provides statistically significant proof of distribution. |
Empirical Validation: Measuring Respirable Dust Interventions
Most industrial air quality claims rely on guesswork. Real-time monitoring systems replace that ambiguity with bar graphs that contrast average respirable dust concentrations before and after cleaning. These side-by-side comparisons offer immediate proof of whether a ventilation change or cleaning cycle actually worked.
Visual proofs highlight that dust spikes align strictly with operational activity. During inactive periods, such as weekends, graphs show minimal variation, confirming that the air 수질 문제 are process-driven. Computational texture mapping further refines these visualizations by modeling roughness elements—like hairs and clumps—using viewing angles to match digital data with physical reality.
켈리랜드 진공 청소기 integrate HEPA filtration systems to drop these measured concentrations. Digital interface layouts track this reduction, allowing managers to see sub-micron particle removal in real-time. This shift from simple suction to sensor-backed data moves cleaning from a maintenance task to a verified safety protocol.
Technical Parameters: Modeling Accumulation and Sensor Precision
Accuracy isn’t accidental. It relies on specific mathematical modeling and precision hardware. To visualize cleanliness, engineers use a dynamic model of dust concentration that accounts for both generation rates and ventilation performance. This allows for predictive bar graphs even in non-isothermal conditions where air movement is unpredictable.
- Accumulation Formula: p(t) = A(α + βt), where A is surface area and α/β represent high-density deposition rates.
- 센서 정밀도: The TSI Model 8475 delivers ±3% accuracy or ±1% full-scale precision for air velocity and particle movement.
- Standardized Grids: Sampling protocols utilize 30.5 × 43.0 cm grids to ensure data consistency across different control volumes.
- Cleanroom Benchmarks: ISO 14644-1 specifies maximum particle counts per m³ for sizes ranging from 0.1 µm to 5 µm.
- 여과 기준: ASHRAE Standard 199-2016 defines 6-stage testing using calcium carbonate dust to simulate real-world loading.
This data-rich approach allows facility managers to correlate visible swarf with invisible submicron aerosols. By using IoT-enabled diagnostics, systems provide live dashboards of filter health and emission levels. This ensures that the system’s performance under load matches the safety envelopes required by NFPA 68 and 69 standards.
프리미엄 OEM/ODM 가정용 진공 청소기 제조 솔루션

Gamification: The Psychology of the Cleaning Feedback Loop
Gamification uses real-time scoring and AI diagnostics to turn maintenance into a measurable game, reducing diagnostic times from hours to minutes through immediate feedback loops.
Behavioral Reinforcement: Positive and Negative Feedback Loops
Feedback loops in professional environments rely on a three-phase cycle: user action, an event, and a modified experience that triggers a repeat action. Positive loops use accomplishment and rewards to reinforce behavior. Negative loops use challenges or consequences to force skill refinement.
이는 언어 학습 앱의 메커니즘과 유사합니다. 기술자가 오류에 대한 즉시 데이터를 받으면, “점수 감소’나 부정적 피드백이 즉각적인 수정을 촉진합니다. 이 사이클은 반복 업무를 완벽이라는 점수를 향한 능동적인 탐구로 전환시킵니다.
성과 정량화: 실시간 채점 및 AI 진단
75F의 Easy Street와 같은 시스템은 작업 품질을 정량화하기 위해 특정 사이트 설치 점수를 할당합니다. 이러한 점수는 오프라인 센서나 최적화되지 않은 구성과 같은 문제에 대한 자동 펭치 리스트를 생성하여 사이트 시운전 과정의 추측을 제거합니다.
- 사이트 설치 점수: 자동 채점(예: 86/100 또는 92/100)은 기술자 성과를 위한 기준선을 제공합니다.
- 진단 효율성: AI 진단은 특정 부품 고장에 대한 기존 수리 작업 시간을 120분에서 단 5분으로 줄입니다.
- 통합 생태계: Salesforce, HubSpot, Microsoft Teams와의 연동을 통해 기존 워크플로우 전반에 실시간 코칭이 가능합니다.
Spinify와 Centrical과 같은 플랫폼은 “사원 목소리” 도구를 통해 이러한 참여를 유지합니다. 개인화된 목표와 실시간 가이드를 활용함으로써 이러한 시스템은 정적인 연차 평가 대신 지속적이고 데이터 기반의 개선 사이클로 교체합니다.
Selling the “Proof”: Why Evidence-Based Cleaning Wins
근거 기반 청소는 주관적인 “깨끗해 보이는” 기준을 측정 가능한 데이터로 대체하며, NFPA 기준치와 실시간 IoT 센서를 사용하여 안전성과 규정 준수 여부를 검증합니다.
| 표준 / 치수 체계 | 한계치 / 벤치마크 | 애플리케이션 |
|---|---|---|
| NFPA 654 | 1/32인치 (0.8mm) | Combustible dust safety limit for surfaces. |
| ISO 14644-1 | Particle counts per m³ | Cleanroom cleanliness classification. |
| MERV 14/16 | ≥75% to 95% efficiency | Filtration of particles ≥0.3 µm. |
| EPA Method 9/22 | Visual Opacity % | Daily proof of emission control performance. |
Quantitative Benchmarks: NFPA 1/32-Inch and Visual Thresholds
Subjectivity is a liability in high-stakes environments. Facilities shift from “guessing” to “knowing” by adopting the NFPA 654 benchmark. This standard defines a hard limit for dust accumulation that dictates when a facility is safe or a localized explosion hazard.
- NFPA 654 Limit: 1/32 inch (0.8 mm) dust layer thickness for combustible materials.
- Layer Depth Criterion (LD): Formula used to adjust thresholds based on specific dust bulk density (ρ).
- Paper Clip Rule: A ~1 mm visual field indicator used by technicians to trigger immediate cleaning.
- NFPA 652 Housekeeping: Mandates documented programs that establish a visual baseline for every shift.
Using these metrics turns a cleaning crew into a compliance team. When you use the LD formula to calculate specific bulk density risks, you provide a data-driven safety product rather than a janitorial service.
Advanced Verification: IoT Monitoring and Analytical Validation
The transition “from suction to sensor” allows for continuous verification. Modern dust collectors and cleanrooms no longer rely on annual audits. They use live diagnostics to prove air quality and surface cleanliness in real-time.
- IoT Diagnostics: Sensors monitor differential pressure and pulse-cleaning frequency to log performance.
- Optical Monitoring: Records particle concentrations from 0.1 μm to 100 μm for ISO compliance.
- ASHRAE 199-2016: Standardized test dust (calcium carbonate) used to simulate real-world loading and cleaning.
- Analytical Validation: High-spec pharma cleaning requires residue sensitivity levels below numeric safety limits.
Precision industries require validated visual inspection protocols. By linking “visually clean” statuses to analytical residue thresholds and time-stamped IoT logs, facilities transform perception into a regulatory data product. This level of proof is mandatory for maintaining ISO 14644-1 classes and meeting EPA opacity requirements.
Technical Implementation for Innovation Scouts
Use ASTM D1739 and OSHA standards to calibrate 10×20 spatial grids, turning discrete sensor data into real-time heatmaps for hardware testing and worker safety.
Standards-Based Frameworks for Dust Measurement and Exposure
Innovation scouts must ground visualization in established engineering metrics rather than visual estimation. Relying on standardized deposition and concentration limits ensures that color-coded dashboards reflect actual regulatory and hardware risks.
- ASTM D1739: Quantifies settleable particulate matter (dustfall) in mg/m²/day using standardized cylindrical gauges.
- OSHA 29 CFR 1910.1000: Sets Time Weighted Average (TWA) thresholds for total and respirable dust in mg/m³.
- NASA-STD-1008: Defines “dirty room” test environments using micrometer-scale (µm) particle-size bounds for hardware stress testing.
- ISO 14644-1: Provides the particle count per m³ baseline across ISO Classes 1–9 for cleanroom and high-precision environments.
Spatio-Temporal Data Modeling and Visualization Platforms
Turning raw data into a heatmap requires interpolating discrete sensor readings across a spatial grid. Modern systems integrate IoT diagnostics and meteorological vectors to move from simple air quality monitoring to predictive safety analytics.
- Spatial Interpolation: Deploy 10 × 20 grids to transform single-point monitor data into continuous concentration surfaces.
- ASHRAE 199-2016: Validates collector behavior using calcium carbonate (CaCO₃) test dust to model real-world loading and cleaning cycles.
- Multi-Sensor Fusion: Integrates airborne concentration, particle size distribution, and wind vectors for real-time decision support.
- IoT Diagnostics: Systems like the CECO Flex-Kleen iSeries track differential pressure and pulse-cleaning frequency to visualize filter health and explosion safety risks (NFPA 68/69).
Wearable optical sensors now provide second-scale temporal resolution. When paired with worker-path traces, these sensors generate exposure trajectory heatmaps that allow safety managers to pinpoint specific operational hazards in mining and construction sites.
마지막 생각
Subjective cleaning is a liability that invites safety violations and regulatory fines. Switching to sensor-driven visualization transforms maintenance from an overhead cost into a measurable, data-backed safety protocol.
Stop guessing and start measuring. Audit your facility against NFPA 654 standards and install IoT-enabled collectors to turn invisible dust into actionable, real-time data points.
자주 묻는 질문
Does the dust visualization unit use a Piezo sensor or an Infrared dust sensor?
No single industry standard mandates one over the other. Piezoelectric and infrared (IR) optical sensors are both common in commercial monitors. Both technologies accurately classify PM2.5 and PM10 mass fractions according to regulatory definitions.
How are different particle sizes like PM2.5 and PM10 visualized on the screen?
Compliant screens map measurements into distinct size bins based on EPA Method 201A and WHO guidance. PM2.5 represents particles ≤2.5 µm, while PM10 includes particles ≤10 µm. Units typically report these as separate channels to provide a clear view of air or surface quality.
Is the sensor data linked to automatic suction adjustment in the vacuum?
Many smart appliances use particle sensor output as a control variable for closed-loop suction adjustment. This linkage is manufacturer-specific rather than a formal industrial mandate, allowing the device to adjust motor power dynamically based on detected dust levels.

 English
 Español
 Français
 Deutsch
 Português do Brasil
 Русский
 한국어
 日本語
 العربية