


غالباً ما تخاطر المنشآت الصناعية بالسلامة من خلال الاعتماد على الفحوصات البصرية ذات الطابع الشخصي، ومع ذلك فإن تراكم غبار بسمك 1/32 بوصة (0.8 مم) فقط - وهو ما يعادل تقريباً سُمك مشبك الورق - يُعَدُّ الحدّ المحدد لخطر الانفجار بموجب معيار NFPA 654. ويتيح الانتقال من الصيانة التفاعلية إلى التصور المدعوم بأجهزة الاستشعار للمشغلين استبدال التخمين ببيانات تجريبية، والاستفادة من تشخيصات الذكاء الاصطناعي لتقليل وقت استكشاف أعطال المكونات من 120 دقيقة إلى خمس دقائق فقط.
يستكشف هذا التحليل الهندسة الكامنة وراء ظاهرة التحميل الكتلي الكهروضوئي والتحوّل نحو جودة الهواء الكمي. ونقوم بتقييم كيفية استخدام منصات مثل فليكس-كلين iSeries و 75F's Easy Street للاستفادة من ISO 14644-1 و ASHRAE 199 المعايير لتحويل الجسيمات العالقة غير المرئية إلى مخططات شريطية قابلة للتنفيذ ودرجات سلامة تفاعلية.

تطور تكنولوجيا التنظيف: من الشفط إلى المستشعرات
Cleaning tech shifted from simple suction to sensor-driven visualization. Systems now use IoT diagnostics to track submicron particles, meeting ASHRAE 199 and ISO 14644-1 standards for safety.
Legacy Systems and the Science of Particulate Visualization
Industrial dust was once treated as a simple mechanical nuisance. Engineers eventually shifted focus toward making invisible aerosols measurable through high-precision imaging and deposit analysis. This transition replaced “naked eye” inspections with quantified data, leading to the development of the first cleanroom standards.
- Thermal precipitators: Collected particles smaller than 10 µm onto electron-microscope grids to prevent imaging bias.
- Aerosol metrology: Utilized moving acetate-film ribbons and optical density to convert dust concentration into a continuous visual trace.
- ISO 14644-1: Established thresholds for particle counts (0.1 µm to 5 µm) across ISO Classes 1–9.
- HEPA and MERV: Defined standardized efficiency profiles based on exact particle size removal.
The Digital Shift: IoT Diagnostics and Performance Standards
عصري أنظمة الترشيح move beyond static ratings. They utilize IoT-enabled diagnostics to monitor system health in real-time. This allows operators to correlate visible grinding dust with submicron welding fumes that would otherwise go undetected by traditional collectors.
- ASHRAE Standard 199-2016: A 6-stage lifecycle test using calcium carbonate test dust to simulate real-world pulse-jet loading.
- MERV 16/16A: Filtration standards requiring 95% removal efficiency for particles ≥0.3 µm.
- NFPA 68 and 69: Safety protocols for explosion venting and prevention in systems handling combustible dust.
- IoT Systems: Platforms like the Flex-Kleen iSeries provide continuous monitoring of differential pressure, pulse frequency, and emissions.
- MERV-A: Includes conditioning tests to prevent efficiency degradation over the filter’s life.
These digital tools transform dust from an environmental risk into a controllable process variable. By aligning real-time sensor data with ASHRAE and ISO standards, facilities ensure both operational safety and consistent air quality without relying on manual spot checks.
علم أجهزة الاستشعار الكهروضوئية: قياس كمّي للغبار الدقيق
Piezoelectric sensors measure respirable dust by tracking frequency drops on vibrating quartz crystals. This mass-loading effect enables real-time, microgram-level quantification of particles under 8 µm.
Piezoelectric Mass-Loading and Resonant Frequency Shifts
Piezoelectric sensors bypass traditional particle counting by using the mass-loading effect. When micro-dust settles on a vibrating quartz crystal, the added mass forces the resonant frequency to drop. This shift provides an immediate electronic signal proportional to the accumulated mass in the gas stream.
- Substrate: AT-cut quartz crystal (1.3 cm diameter, 180 µm thick).
- Base Frequency: 9 MHz resonance.
- Electrodes: Gold or silver surfaces for particle deposition.
- Configuration: 9-element modular arrays for in-situ monitoring in aerospace or heavy manufacturing.
High Q-factor engineering ensures these systems detect microgram mass changes. This sensitivity allows operators to identify fluctuations in air quality before they violate safety thresholds or damage precision equipment.
Quantitative Metrics and Size Selectivity Standards
Accuracy depends on the Sauerbrey relationship, which translates frequency shifts into mass data. Industrial systems isolate specific particle sizes to ensure data reflects respirable risks rather than harmless larger debris that could bias the sensor.
- Calculation: ΔF = -Dm · F / (R · t · A) (where Dm represents mass change in µg).
- Size Threshold: Respirable dust limited to <8 µm; larger particles are diverted via cyclones.
- Thermal Stability: GT-cut quartz variants eliminate temperature coefficients between 0–40°C.
- Mechanical Spec: PVDF piezo films provide a modulus of 10^9–10^10 Pa with moisture absorption below 0.02%.
These metrics align with ISO 14644-1 and ASHRAE 199. By integrating these sensors into IoT-enabled collectors, facilities move from reactive maintenance to quantified, real-time visualization of dust as a dynamic process variable.
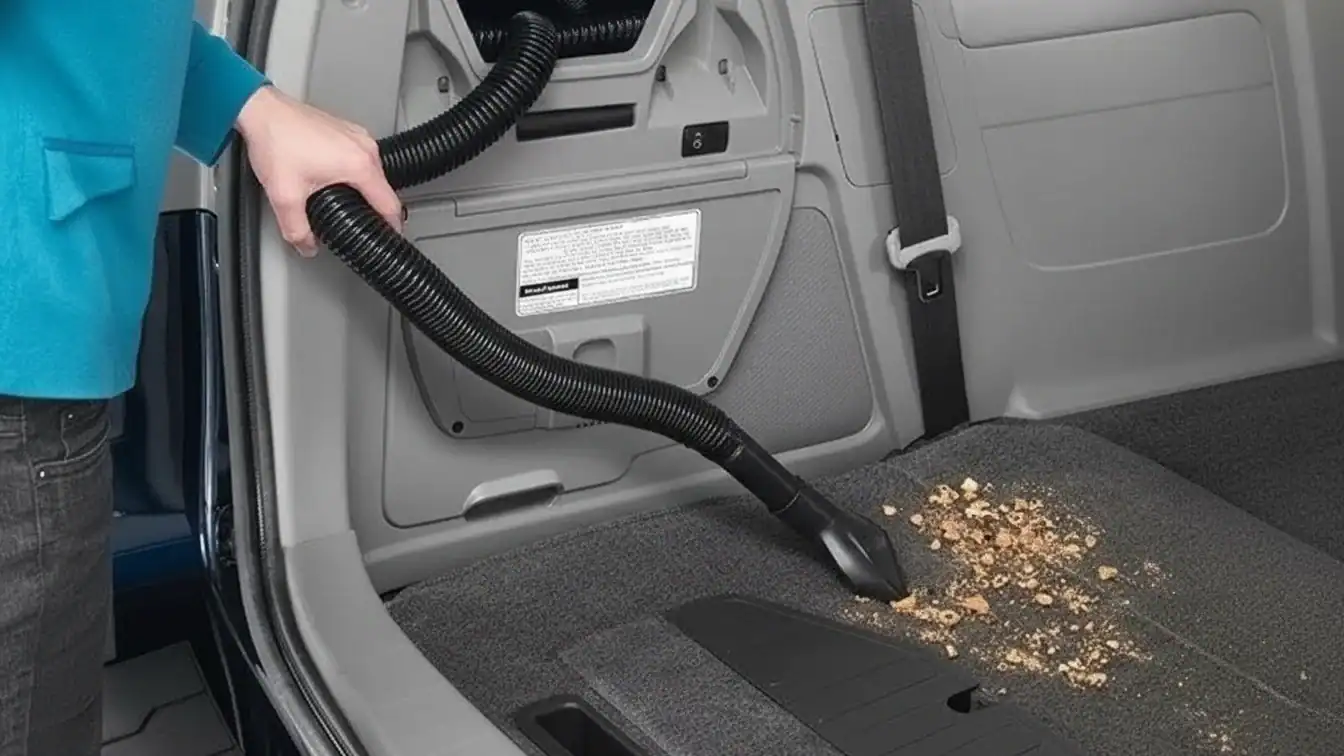
تصوير النظافة: كيف توفّر المخططات الشريطية إثباتاً في الوقت الفعلي
Bar graphs convert sensor data and accumulation formulas into immediate visual evidence, contrasting pre- and post-cleaning dust levels to validate filtration performance and operational air quality.
| المقياس/المعلمة | المعيار الفني / القيمة | الدور في التصور المرئي |
|---|---|---|
| نموذج التراكم | p(t) = A(α + βt) | يتنبأ بمعدلات الترسيب بناءً على مساحة السطح. |
| دقة المستشعر | ±3% (TSI Model 8475) | يضمن سلامة البيانات التجريبية في الرسوم البيانية في الوقت الفعلي. |
| كفاءة الترشيح | MERV 14/16 (ASHRAE 52.2) | يحدد المعيار لمعدلات إزالة الجسيمات. |
| بروتوكول أخذ العينات | فترات 15 ثانية / شبكة أبعادها 30.5×43.0 سم | يوفر دليلاً ذا دلالة إحصائية على التوزيع. |
التحقق التجريبي: قياس تدخلات الغبار القابل للتنفس
تعتمد معظم ادعاءات جودة الهواء الصناعي على التخمين. تستبدل أنظمة المراقبة في الوقت الفعلي هذا الغموض برسوم بيانية شريطية تقارن متوسط تركيزات الغبار القابل للتنفس قبل التنظيف وبعده. تقدم هذه المقارنات الجانبية دليلاً فورياً حول ما إذا كان تغيير التهوية أو دورة التنظيف قد أثمر عن نتائج فعلية.
تسلط الأدلة البصرية الضوء على أن الارتفاعات المفاجئة في الغبار تتطابق بدقة مع النشاط التشغيلي. خلال فترات الخمول، مثل عطلات نهاية الأسبوع، تُظهر الرسوم البيانية تقلبات طفيفة، مما يؤكد أن الهواء 2. يسرع مباشرة الطلب في السوق على منتجات إزالة الترسبات المتخصصة وأنظمة تليين المياه المنزلية. أصبح مشغلو الأساطيل والمستهلكون العاديون الآن يعتبرون صيانة الأجهزة ضرورة بصرية بدلاً من مهمة مؤجلة. are process-driven. Computational texture mapping further refines these visualizations by modeling roughness elements—like hairs and clumps—using viewing angles to match digital data with physical reality.
كيلي لاندز مكانس كهربائية integrate HEPA filtration systems to drop these measured concentrations. Digital interface layouts track this reduction, allowing managers to see sub-micron particle removal in real-time. This shift from simple suction to sensor-backed data moves cleaning from a maintenance task to a verified safety protocol.
Technical Parameters: Modeling Accumulation and Sensor Precision
Accuracy isn’t accidental. It relies on specific mathematical modeling and precision hardware. To visualize cleanliness, engineers use a dynamic model of dust concentration that accounts for both generation rates and ventilation performance. This allows for predictive bar graphs even in non-isothermal conditions where air movement is unpredictable.
- Accumulation Formula: p(t) = A(α + βt), where A is surface area and α/β represent high-density deposition rates.
- دقة المستشعر: The TSI Model 8475 delivers ±3% accuracy or ±1% full-scale precision for air velocity and particle movement.
- Standardized Grids: Sampling protocols utilize 30.5 × 43.0 cm grids to ensure data consistency across different control volumes.
- Cleanroom Benchmarks: ISO 14644-1 specifies maximum particle counts per m³ for sizes ranging from 0.1 µm to 5 µm.
- معايير الترشيح: ASHRAE Standard 199-2016 defines 6-stage testing using calcium carbonate dust to simulate real-world loading.
This data-rich approach allows facility managers to correlate visible swarf with invisible submicron aerosols. By using IoT-enabled diagnostics, systems provide live dashboards of filter health and emission levels. This ensures that the system’s performance under load matches the safety envelopes required by NFPA 68 and 69 standards.
حلول تصنيع المكانس الكهربائية المنزلية OEM/ODM الممتازة

تفاعل الألعاب: علم نفس حلقة التغذية الراجعة للتنظيف
Gamification uses real-time scoring and AI diagnostics to turn maintenance into a measurable game, reducing diagnostic times from hours to minutes through immediate feedback loops.
Behavioral Reinforcement: Positive and Negative Feedback Loops
Feedback loops in professional environments rely on a three-phase cycle: user action, an event, and a modified experience that triggers a repeat action. Positive loops use accomplishment and rewards to reinforce behavior. Negative loops use challenges or consequences to force skill refinement.
This mirrors the mechanics of language learning apps. When a technician receives immediate data on an error, the “point loss” or negative feedback drives instant correction. This cycle transforms repetitive tasks into an active pursuit of a perfect score.
Quantifying Performance: Real-Time Scoring and AI Diagnostics
Systems like 75F’s Easy Street assign specific site installation scores to quantify work quality. These scores generate automated punch lists for issues like offline sensors or unoptimized configurations, removing the guesswork from site commissioning.
- Site Installation Scores: Automated grading (e.g., 86/100 or 92/100) provides a baseline for technician performance.
- Diagnostic Efficiency: AI diagnostics reduce traditional troubleshooting from 120 minutes to just 5 minutes for specific component failures.
- Integration Ecosystems: Connectivity with Salesforce, HubSpot, and Microsoft Teams enables real-time coaching across existing workflows.
Platforms like Spinify and Centrical sustain this engagement through “Voice of the Employee” tools. By utilizing personalized goals and real-time guidance, these systems replace static annual reviews with continuous, data-driven improvement cycles.
بيع “الإثبات”: لماذا يفوز التنظيف المستند إلى الأدلة
Evidence-based cleaning replaces subjective “looks clean” standards with measurable data, using NFPA thresholds and real-time IoT sensors to verify safety and compliance.
| Standard / Metric | Threshold / Benchmark | التطبيق |
|---|---|---|
| NFPA 654 | 1/32 inch (0.8 mm) | Combustible dust safety limit for surfaces. |
| ISO 14644-1 | Particle counts per m³ | Cleanroom cleanliness classification. |
| MERV 14/16 | ≥75% to 95% efficiency | Filtration of particles ≥0.3 µm. |
| EPA Method 9/22 | Visual Opacity % | Daily proof of emission control performance. |
Quantitative Benchmarks: NFPA 1/32-Inch and Visual Thresholds
Subjectivity is a liability in high-stakes environments. Facilities shift from “guessing” to “knowing” by adopting the NFPA 654 benchmark. This standard defines a hard limit for dust accumulation that dictates when a facility is safe or a localized explosion hazard.
- NFPA 654 Limit: 1/32 inch (0.8 mm) dust layer thickness for combustible materials.
- Layer Depth Criterion (LD): Formula used to adjust thresholds based on specific dust bulk density (ρ).
- Paper Clip Rule: A ~1 mm visual field indicator used by technicians to trigger immediate cleaning.
- NFPA 652 Housekeeping: Mandates documented programs that establish a visual baseline for every shift.
Using these metrics turns a cleaning crew into a compliance team. When you use the LD formula to calculate specific bulk density risks, you provide a data-driven safety product rather than a janitorial service.
Advanced Verification: IoT Monitoring and Analytical Validation
The transition “from suction to sensor” allows for continuous verification. Modern dust collectors and cleanrooms no longer rely on annual audits. They use live diagnostics to prove air quality and surface cleanliness in real-time.
- IoT Diagnostics: Sensors monitor differential pressure and pulse-cleaning frequency to log performance.
- Optical Monitoring: Records particle concentrations from 0.1 μm to 100 μm for ISO compliance.
- ASHRAE 199-2016: Standardized test dust (calcium carbonate) used to simulate real-world loading and cleaning.
- Analytical Validation: High-spec pharma cleaning requires residue sensitivity levels below numeric safety limits.
تتطلب الصناعات الدقيقة بروتوكولات فحص بصرية معتمدة. من خلال ربط “النظافة البصرية” بالحواجز التحليلية للبقايا وسجلات إنترنت الأشياء المقيدة زمنياً، تحوّل المرافق الإ perception إلى منتج بيانات تنظيمي. هذا المستوى من الإثبات إلزامي للحفاظ على فئات ISO 14644-1 وتلبية متطلبات EPA للعتمة.
التطبيق التقني لباحثي الابتكار
استخدم معايير ASTM D1739 و OSHA لمعايرة الشبكات المكانية 10×20، مما يحوّل بيانات المستشعرات المنفصلة إلى خرائط حرارية في الوقت الفعلي لاختبار المعدات وسلامة العمال.
أطر العمل القائمة على المعايير لقياس الغبار والتعرض له
Innovation scouts must ground visualization in established engineering metrics rather than visual estimation. Relying on standardized deposition and concentration limits ensures that color-coded dashboards reflect actual regulatory and hardware risks.
- ASTM D1739: Quantifies settleable particulate matter (dustfall) in mg/m²/day using standardized cylindrical gauges.
- OSHA 29 CFR 1910.1000: Sets Time Weighted Average (TWA) thresholds for total and respirable dust in mg/m³.
- NASA-STD-1008: Defines “dirty room” test environments using micrometer-scale (µm) particle-size bounds for hardware stress testing.
- ISO 14644-1: Provides the particle count per m³ baseline across ISO Classes 1–9 for cleanroom and high-precision environments.
Spatio-Temporal Data Modeling and Visualization Platforms
Turning raw data into a heatmap requires interpolating discrete sensor readings across a spatial grid. Modern systems integrate IoT diagnostics and meteorological vectors to move from simple air quality monitoring to predictive safety analytics.
- Spatial Interpolation: Deploy 10 × 20 grids to transform single-point monitor data into continuous concentration surfaces.
- ASHRAE 199-2016: Validates collector behavior using calcium carbonate (CaCO₃) test dust to model real-world loading and cleaning cycles.
- Multi-Sensor Fusion: Integrates airborne concentration, particle size distribution, and wind vectors for real-time decision support.
- IoT Diagnostics: Systems like the CECO Flex-Kleen iSeries track differential pressure and pulse-cleaning frequency to visualize filter health and explosion safety risks (NFPA 68/69).
Wearable optical sensors now provide second-scale temporal resolution. When paired with worker-path traces, these sensors generate exposure trajectory heatmaps that allow safety managers to pinpoint specific operational hazards in mining and construction sites.
خاتمة
Subjective cleaning is a liability that invites safety violations and regulatory fines. Switching to sensor-driven visualization transforms maintenance from an overhead cost into a measurable, data-backed safety protocol.
Stop guessing and start measuring. Audit your facility against NFPA 654 standards and install IoT-enabled collectors to turn invisible dust into actionable, real-time data points.
الأسئلة المتداولة
Does the dust visualization unit use a Piezo sensor or an Infrared dust sensor?
No single industry standard mandates one over the other. Piezoelectric and infrared (IR) optical sensors are both common in commercial monitors. Both technologies accurately classify PM2.5 and PM10 mass fractions according to regulatory definitions.
How are different particle sizes like PM2.5 and PM10 visualized on the screen?
Compliant screens map measurements into distinct size bins based on EPA Method 201A and WHO guidance. PM2.5 represents particles ≤2.5 µm, while PM10 includes particles ≤10 µm. Units typically report these as separate channels to provide a clear view of air or surface quality.
Is the sensor data linked to automatic suction adjustment in the vacuum?
Many smart appliances use particle sensor output as a control variable for closed-loop suction adjustment. This linkage is manufacturer-specific rather than a formal industrial mandate, allowing the device to adjust motor power dynamically based on detected dust levels.

 English
 Español
 Français
 Deutsch
 Português do Brasil
 Русский
 한국어
 日本語
 العربية