 Pular para o conteúdo principal Pular para o rodapé
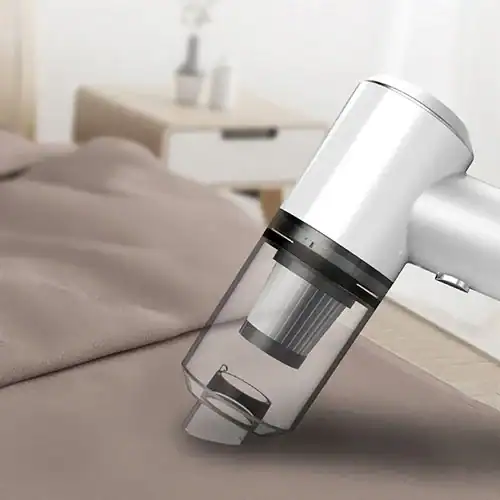
Projetar um sistema de sucção de alto desempenho exige superar a “queda de tensão” inerente à descarga de íon-lítio; enquanto as unidades com bateria atingem o pico inicial e depois caem, os motores conectados à rede puxam 7–12 A continuamente da rede CA para manter um limite de sucção de 3000 Pa. Essa vantagem arquitetônica permite 1500 W de saída sustentada, contornando os limites térmicos e de descarga que forçam as alternativas sem fio a reduzir o desempenho conforme as células passam por queda estrutural de tensão em mais de 400 ciclos.
Esta análise técnica avalia a transição dos módulos DC-DC subordinados para front-ends CA de sistema completo, referenciando o desempenho da onsemi 600W-ACDC-GEVB e GAPTEC padrões de isolamento. Examinamos como a conformidade com a ANSI C84.1 e IEC 62368 garante torque consistente e um menor custo total de propriedade em comparação com a sobrecarga recorrente da manutenção da bateria.
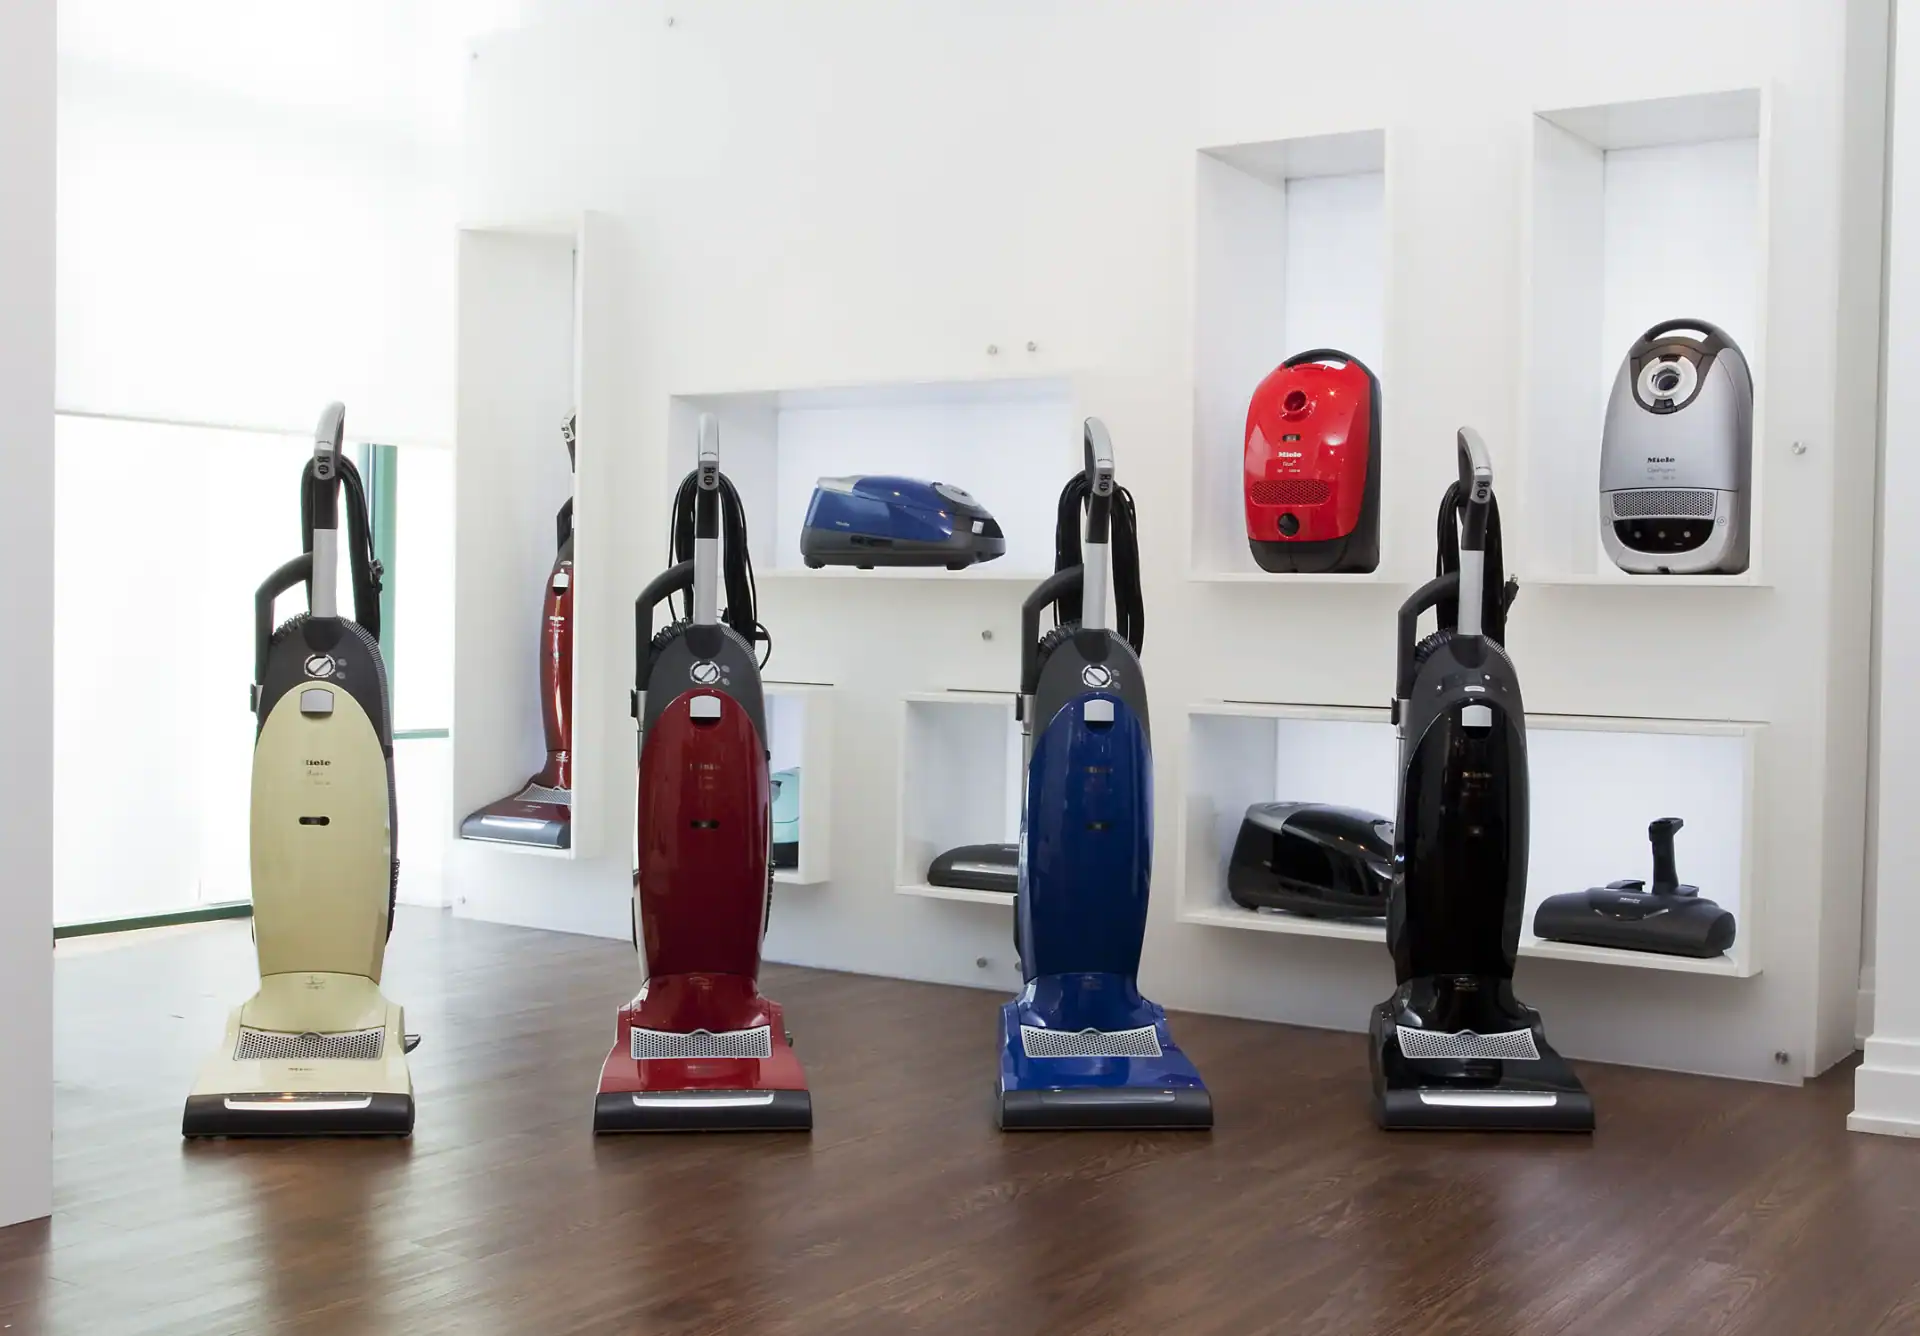
A lacuna de potência: 600 W CA versus 150 W CC
Passar de 150 W CC para 600 W CA muda de regulação de componentes para gerenciamento de sistema completo, adicionando correção de fator de potência e isolamento de segurança complexo para conectividade direta à rede.
Um projeto de 600 W CA não é apenas uma versão ampliada de um módulo de 150 W. Ele representa uma mudança fundamental na cadeia de energia. Enquanto uma unidade de 150 W CC atua como conversor subordinado dentro de um sistema maior, o front-end CA de 600 W funciona como a porta de entrada principal para cargas industriais ou de TI.
Papéis Arquiteturais: Front-ends de Sistema Completo vs. Módulos Subordinados
A distinção reside em onde essas unidades estão posicionadas em relação à fonte de alimentação. Um sistema de 600W, como o onsemi 600W-ACDC-GEVB, lida diretamente com a rede CA de 110–230 Vrms. Em contraste, conversores CC de 150W normalmente ficam atrás de um enlace CC de alta tensão pré-regulado.
- Front-end AC de 600W: Converte 110–230 Vrms para 48V a 12,5A.
- Módulo DC de 150W: Opera a partir de um enlace nominal de +380 VCC (por exemplo, Power Integrations RD-239).
- Eficiência do PFC: Sistemas de 600W devem alcançar eficiência de ~97% usando estágios de PFC entrelaçados.
- Frequência de Chaveamento: Estágios DC de 150W atingem até 250 kHz para maximizar a densidade em ambientes pré-regulados.
Os engenheiros devem considerar o estágio de PFC nos projetos de 600W para manter a eficiência. As unidades DC de 150W contornam essa complexidade porque o estágio anterior já estabilizou o barramento de alta tensão.
Parâmetros Técnicos: Normas de Segurança e Desempenho Térmico
Os requisitos de segurança aumentam conforme os níveis de potência e as tensões de entrada sobem. Sistemas conectados à rede CA exigem isolamento rigoroso e espaçamento físico que os menores módulos DC simplesmente não necessitam.
- Isolamento: Até 4000 Vac para fontes GAPTEC AC-DC de 150W.
- Distância de fuga e folga: Folga primário-secundária de 8 mm e distância de fuga de 9,2 mm (IEC 61800-5-2).
- Conformidade regulatória: Normas IEC/EN/UL 62368 e EN60335 para segurança de equipamentos eletroeletrônicos.
- Metas de desempenho: Regulagem de tensão em ±1% com ripple entre 150–200 mV p-p.
A classe AC de 600W exige topologias ressonantes LLC entrelaçadas para gerenciar a complexidade da Lista de Materiais (BOM). Essa estratégia de gerenciamento térmico garante que a unidade suporte alta densidade de potência sem comprometer a precisa regulagem de ±1% necessária para eletrônicos industriais sensíveis.
Por que motores conectados à rede oferecem desempenho superior de sucção
O consumo direto da rede elétrica CA permite saída de 1500W e sucção de 3000 Pa. Esses motores contornam os limites de descarga da bateria para manter torque e RPM máximos mesmo sob alta resistência ao fluxo de ar.
| Métrica de desempenho | Modelos com fio | Modelos sem fio | Modelos portáteis |
|---|---|---|---|
| Pressão de sucção (Pa) | 2000 – 3000 Pa | 1500 – 2500 Pa | 1000 – 2000 Pa |
| Potência Típica | 500W – 1500W | 200W – 400W | 100W – 200W |
| Corrente de Operação | 7 – 12 Amps (AC) | Battery Discharge Ltd | Battery Discharge Ltd |
Unrestricted AC Power and Current Stability
Corded motors pull energy directly from AC mains, removing the performance bottlenecks inherent in lithium-ion discharge cycles. While battery units suffer from “voltage sag” as they deplete, corded systems maintain a flat power curve from start to finish. This allows engineers to utilize thru-flow motor designs that prioritize raw mechanical work over the strict energy efficiency required for portable tools.
- AC Current Draw: 7-12 amps continuous from 110-230V mains.
- Wattage Ceiling: Supports up to 1500W loads; far exceeding the 100-200W range of typical handhelds.
- Power Architecture: Employs robust front-end supplies with PFC (Power Factor Correction) for up to 97% efficiency at high loads.
High-wattage AC front-ends handle the thermal demands of heavy-duty cleaning better than DC counterparts. Industrial-grade components within these motors manage the heat generated by sustained high-RPM operation, ensuring the unit doesn’t throttle performance to protect internal circuitry.
Suction Metrics: Pa Ratings and Torque Dynamics
Suction effectiveness depends on the relationship between current and mechanical torque. In corded systems, motor torque scales with the square of the current under light loads. This relationship means doubling the current provides a fourfold increase in torque, allowing the fan to overcome air inertia and maintain high-velocity airflow even as the nozzle encounters debris resistance.
- Suction Floor: Minimum 2000 Pa rating, peaking at 3000 Pa for deep-carpet extraction.
- Dinâmica de carga: A resistência ao fluxo de ar reduz o volume de ar processado, o que paradoxalmente diminui a carga no motor e aumenta as RPM até se atingir uma sucção máxima sellada.
- Saturação de torque: O fornecimento de CA em alta tensão permite que o motor atinja limites de saturação que motores DC alimentados por bateria não conseguem igualar sem peso excessivo.
Quando a cabeça do aspirador sela contra uma superfície, os motores com fio beneficiam-se da ausência de fluxo de ar para acelerar o ventilador. Isso cria a diferença de alta pressão necessária para levantar partículas pesadas. As unidades a bateria frequentemente não dispõem da reserva de corrente para sustentar esses picos, resultando em menor capacidade de elevação durante manobras de limpeza profunda.
A vantagem da alimentação CA: tensão constante versus degradação da bateria
A energia utilitária de CA oferece estabilidade regulada dentro de ±5% conforme ANSI C84.1. As baterias declinam inherentemente devido à depleção do estado de carga, resistência interna e degradação química da tensão baseada nos ciclos.
| Recurso | Alimentação utilitária de CA | Energia DC armazenada em bateria |
|---|---|---|
| Faixa de regulação | 114V – 126V (±5%) | Varia conforme o estado de carga (SOC) |
| Perfil de tensão | Forma de onda constante | Declínio linear ou em platô |
| Estabilidade a longo prazo | Estabilidade ao longo da vida útil | Atenuação de Tensão Estrutural (400+ ciclos) |
| Gerenciamento do Sistema | Passivo (Transformadores/Feeders) | Ativo (BMS e Regulagem DC-DC) |
Estabilidade da Rede e Padrões ANSI C84.1 para Tensão Constante
A energia das utilitárias norte-americanas mantém uma faixa de entrada previsível. As concessionárias utilizam configurações de tap de transformador e projetos de feeder engenharia para garantir que a forma de onda CA permaneça constante durante toda a vida útil do equipamento. Isso elimina a necessidade de superdimensionar sistemas para acomodar as grandes variações encontradas em fontes de energia química.
- Padrão: Faixa A — ANSI C84.1
- Tensão de Serviço: 114V a 126V (±5% de 120V nominal)
- Método de Regulagem: Ajuste de tap do transformador e projeto de feeder de distribuição
- Desempenho sob Carga: Os sistemas de distribuição minimizam a queda de tensão em regime permanente de queda de tensão sob faixas normais de carga
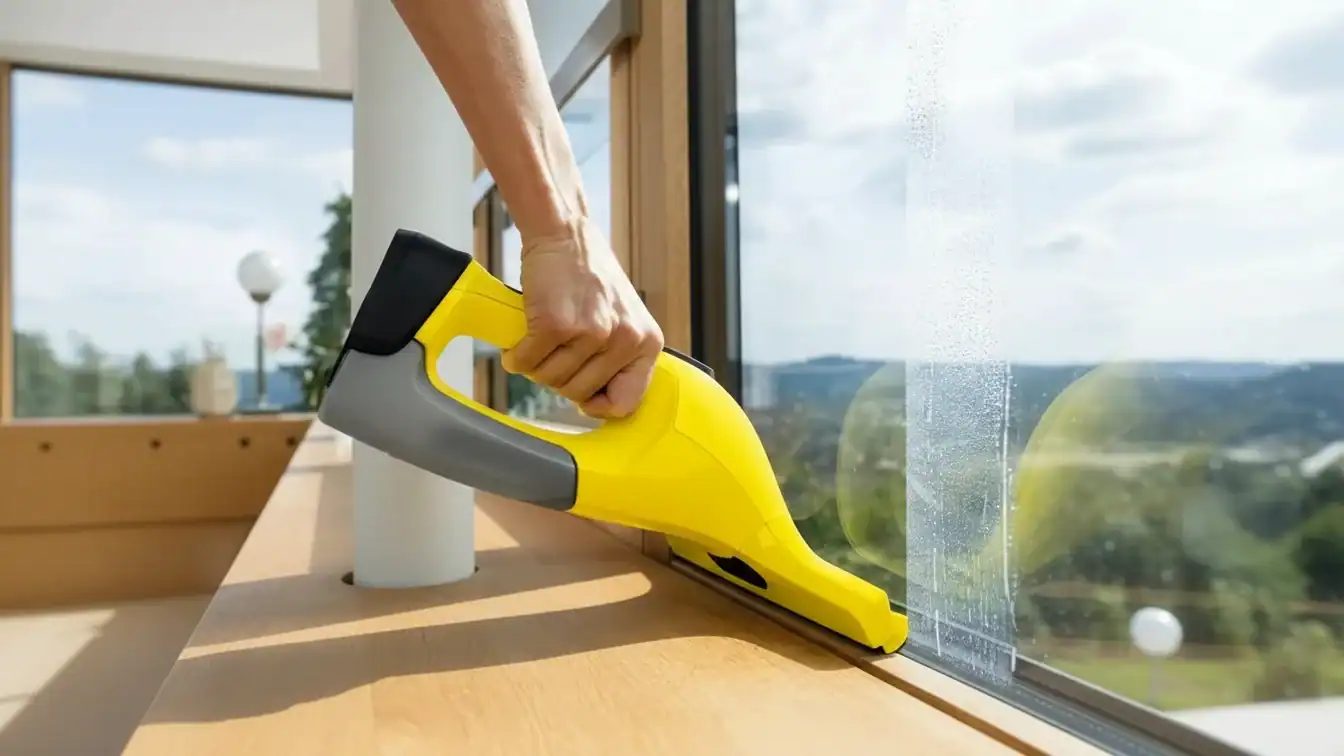
Dinâmica da Tensão da Bateria: Queda, Curvas de Descarga e Degradação por Ciclos
As baterias apresentam declínio de tensão em vários níveis. A queda instantânea nos terminais ocorre assim que uma carga é aplicada, devido à resistência interna. Esse efeito se agrava conforme a bateria envelhece ou opera em temperaturas baixas. Embora as fontes de CA forneçam estabilidade por padrão, os sistemas de bateria exigem regulação ativa CC-CC para emular uma saída consistente para motores e aquecedores.
- Perfil do Chumbo-Ácido: Apresenta queda de tensão praticamente linear durante todo o ciclo de descarga.
- Perfil do Íon-Lítio: Mantém um platô aplanado seguido de uma queda acentuada próxima à carga de 0%.
- Desvanecimento de tensão: Cátodos avançados como Li1.2Ni0.15Mn0.55Co0.1O2 sofrem degradação estrutural, reduzindo o potencial de descarga após 400–500 ciclos.
- Limites em standby: As metas de engenharia frequentemente limitam as células de íon-lítio a 4,00V para trocar energia máxima por estabilidade a longo prazo.
- Compensação térmica: Células de chumbo-ácido requerem -3 a -4 mV/°C por célula para manter a tensão de terminal segura.
A diferença entre energia CA e energia de bateria é uma questão de sobrecarga operacional. Um alimentador CA de entrada oferece uma barra de entrada estável. Um sistema com bateria exige um Sistema de Gerenciamento de Bateria (BMS) e estágios secundários CC-CC apenas para atingir o mesmo nível de desempenho, adicionando custo e complexidade significativos ao projeto.
Expanda sua marca com aspiradores de pó OEM/ODM de alto desempenho

Eficiência de custo: por que a opção com cabo oferece melhor valor a longo prazo
Ferramentas com cabo eliminam a necessidade de $100 substituições de bateria e quedas de desempenho, oferecendo saída constante de 5.500 RPM e custos iniciais mais baixos para canteiros de obra com acesso à energia.
Economia inicial e os custos ocultos da manutenção de baterias
A compra de equipamentos com fio reduz o investimento inicial ao eliminar a necessidade de baterias proprietárias e estações de carregamento. Embora os sistemas sem fio ofereçam mobilidade, eles apresentam encargos recorrentes de manutenção que encarecem o custo total de propriedade em um período padrão de três anos.
- Custo de substituição da bateria: $100 por unidade, necessário após aproximadamente 1.000 ciclos de carga, à medida que as células se degradam.
- Sobrecarga no fluxo de trabalho: Elimina a troca constante de baterias e a necessidade de backups redundantes de bateria para evitar paradas na operação.
- Preço de compra: Os modelos com fio custam significativamente menos do que as versões sem fio pois dispensam a eletrônica complexa de gerenciamento de energia.
Longevidade técnica: desempenho sustentável versus degradação dos modelos sem fio
As ferramentas com fio são alimentadas diretamente pela rede elétrica CA, utilizando frequentemente estágios de entrada de alta eficiência capazes de entregar saídas de 600W com 97% de eficiência. Isso garante que o motor receba energia constante, independentemente da duração da operação, evitando a queda de torque que ocorre à medida que a voltagem da bateria se esgota.
- Desempenho da serra circular: Velocidade sustentada de 5.500 RPM.
- Furadeiras padrão: 3.100 RPM sem perda de potência.
- Perfuração com martelo: 52.700 BPM para trabalhos de alvenaria de alto impacto.
- Ergonomia: A redução do peso da ferramenta, sem a bateria acoplada, diminui a fadiga do operador durante tarefas de retificação ou perfuração de dia inteiro.
A arquitetura de energia CA de 600W permite classificações mais elevadas dos componentes e melhor projeto térmico. Isso se traduz em uma ferramenta que resiste a ciclos de uso pesado, onde módulos sem fio DC de 150W podem superaquecer ou acionar desligamentos de segurança durante cortes profundos ou perfurações intensivas.
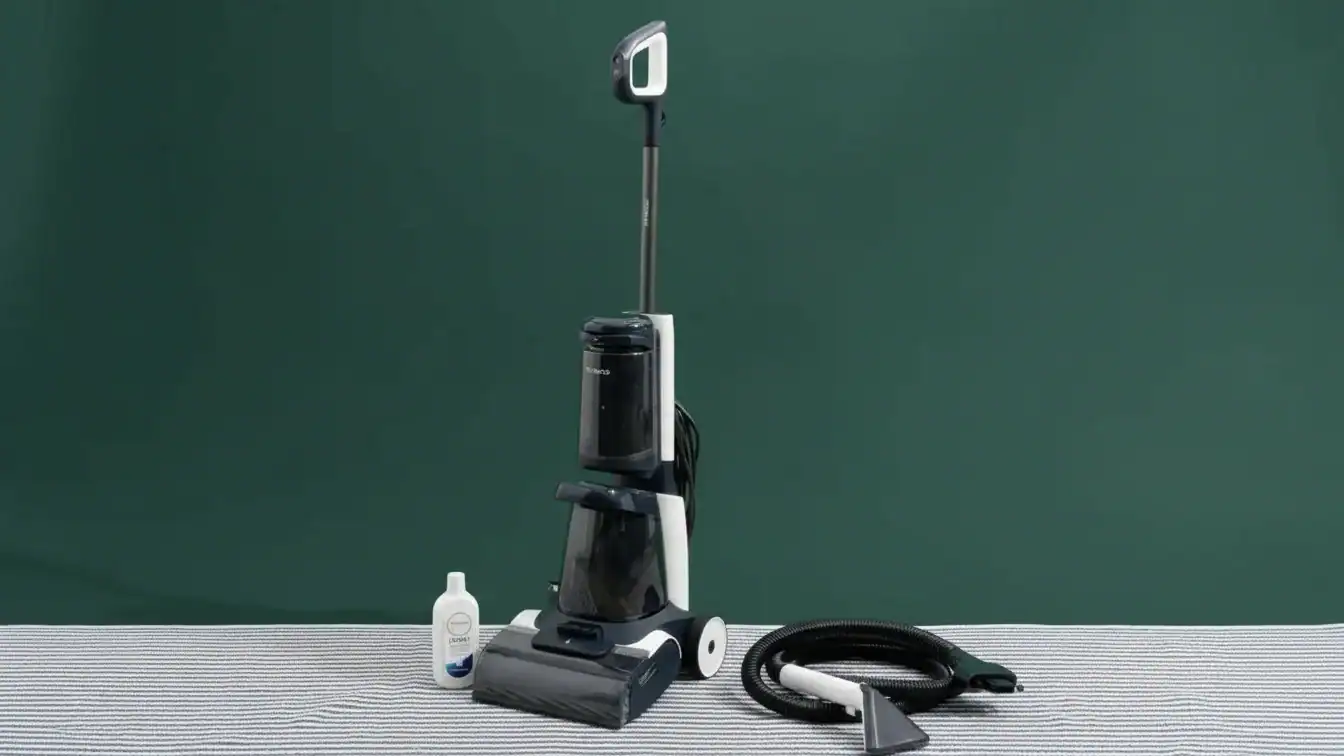
Confiabilidade de engenharia e custos do ciclo de vida
Os engenheiros monetizam a confiabilidade convertendo o MTBF em probabilidades anuais de falha, permitindo comparações de custos de 25 a 40 anos que justificam investimentos preventivos contra riscos de falha não mitigados.
Quantificação da Confiabilidade por meio de MTBF e Modelagem de Risco de Falha
A confiabilidade é uma função matemática do tempo, não um atributo qualitativo. Um componente com uma média entre falhas (MTBF) de 3 anos apresenta probabilidade anual de falha de 28,341%. Reduzir esse MTBF para 2 anos diminui a confiabilidade anual para aproximadamente 60,651%. Essas probabilidades permitem que os engenheiros projetem custos reais em modelos de custo do ciclo de vida (LCC).
A modelagem de risco de falha monetiza essas taxas ao deduzir os custos esperados. Para um componente com custo de falha de 1, o modelo contabiliza o valor integral a cada dois anos ou suaviza o custo do risco anualmente com base na probabilidade derivada do MTBF. Essa transparência identifica a estratégia de menor custo ao longo da vida do ativo.
As estratégias de manutenção preditiva e preventiva representam consistentemente a opção de menor custo do ciclo de vida. Mesmo quando esses modelos exigem mais recursos iniciais, eles superam os modelos reativos ao evitar paralisações catastróficas. Por exemplo, um investimento preventivo com valor presente de 1 é economicamente justificado diante de uma futura falha não mitigada que custaria 1 no quinto ano.
Normas, Horizontes de Análise e Limites Obrigatórios de LCC
As estruturas regulatórias determinam a duração e a profundidade da análise de LCC. Normas de engenharia do setor público, incluindo o Manual NIST 135 e as diretrizes da Iowa LCCA, estabelecem um período padrão de análise de 25 anos para sistemas prediais. O regulamento USACE ER 1110-1-8173 amplia esses horizontes para 40 anos ou para o menor múltiplo comum das vidas úteis alternativas.
- Manual NIST 135: Define os critérios federais dos EUA para descontos em sistemas de energia e construção.
- Série ISO 15686: Fornece o quadro internacional para planejamento da vida útil e sustentabilidade econômica.
- BS/EN 16627: Padroniza regras para aquisições na construção e avaliações econômicas.
- ASHRAE 90.1: Atua como o padrão energético básico para a avaliação de alternativas de construção militar do USACE.
A CLV de engenharia deve capturar o espectro completo dos custos de propriedade para ser válida. Diretrizes estaduais, como as de Iowa, exigem que qualquer projeto proposto demonstre CLV de 25 anos igual ou inferior à linha de base mínima do código. Esta comparação deve incluir explicitamente os seguintes pontos de dados:
- Capital Inicial: Custos de aquisição, instalação e comissionamento.
- Modos de Manutenção: Gastos periódicos, preditivos, preventivos e corretivos.
- Impacto Operacional: Reverões, perdas de paralisação e danos secundários decorrentes de interrompimentos não planejados.
- Fim da Vida Útil: Descarte ambiental, prazo de reposição e valor residual de sucata.
Considerações finais
O conforto sem fio é uma armadilha de desempenho para tarefas industriais ou de limpeza de alta demanda. A energia CA garante sucção máxima e estabilidade térmica que as baterias não podem igualar sem custos massivos e falha química inevitável.
Priorize equipamentos com fio para todas as zonas de alta intensidade para eliminar ciclos de substituição de bateria TP4T100. Utilize uma auditoria de ciclo de vida de 3 anos para afastar operações pesadas de ferramentas subdimensionadas e dependentes de bateria.
Perguntas frequentes
Qual é a comparação de potência de sucção (kPa) entre um aspirador CA de 600W e um modelo sem fio CC de 150W?
O padrão da indústria para sucção de aspiradores CA de 600W varia de 14 a 18 kPa. Aspiradores CC de 150W aspirador vertical sem fio os modelos normalmente atingem 8–12 kPa. O modelo AC oferece de 1,5 a 2 vezes mais força de sucção total.
A unidade conta com proteção térmica contra sobrecarga para o motor de alta potência?
Sim. Os motores de alta potência incluem proteção térmica contra sobrecarga conforme as normas IEC 60335-1. Isso garante segurança operacional durante tarefas de limpeza pesada, evitando o superaquecimento.
O motor é projetado para operação contínua sem necessidade de período de ‘resfriamento’?
Sim. Esses motores AC suportam operação contínua superior a 30 minutos. Eles aproveitam as vantagens da dissipação de potência CA, contornando as limitações térmicas comuns em motores CC alimentados por bateria.
 English
  Español
  Français
  Deutsch
  Português do Brasil
  Русский
  한국어
한국어  日本語
日本語  العربية